ALLotaxonometer for all
Quicklinks
Demonstration Page: https://observablehq.com/@jstonge/allotaxonometer-for-all
GitHub Repo:
Partners
Jonathan St-Onge
Samuel Rosenblatt
Carter Ward
Summary
Completed (October – December 2022)
The AlloTaxonometer was a Graduate Student Project to translate the previouse version of AlloTaxonometer from Matlab to Javascript. VERSO provided project management and added common industry practices like using Jira, creating stories and epics, doing standups during the week, creating a product requirements doc (much of which was used in this page) and ensuring the final product would be much more open source friendly.
Background
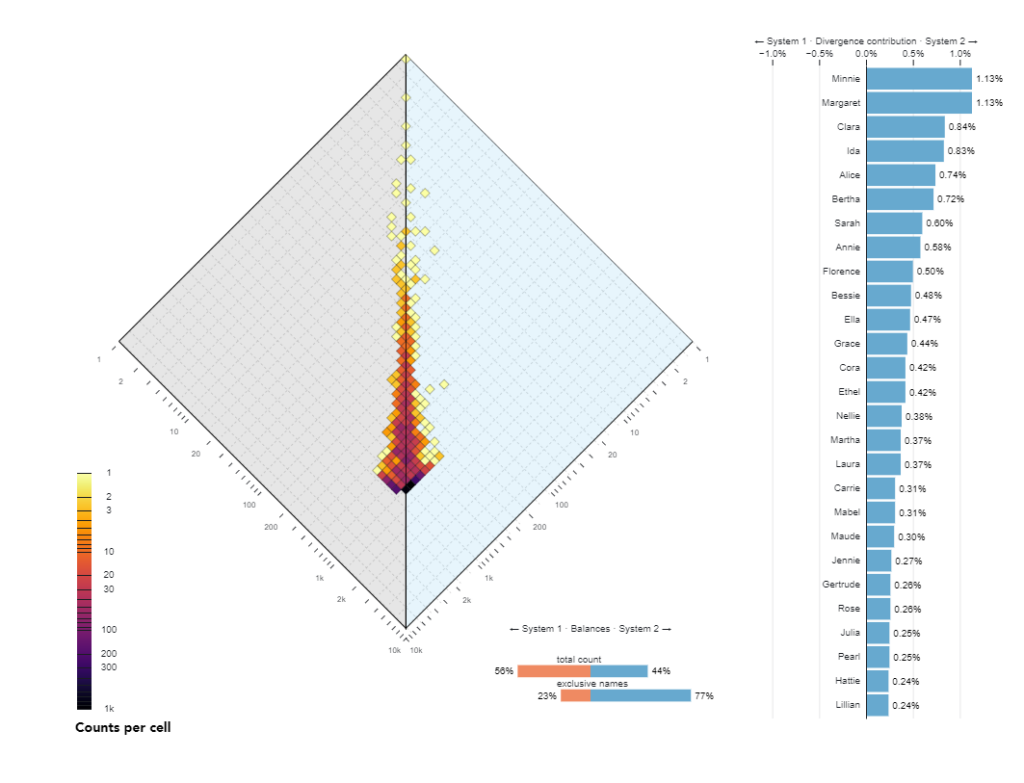
The ALLotaxonometry project was originally created in 2019 with Peter Dodds and team and was published in the paper Allotaxonometry and rank-turbulence divergence: A universal instrument for comparing complex systems (link)which introduced ‘allotaxonometry’ along with ‘rank-turbulence divergence’, a tunable instrument for comparing any two (Zipfian) ranked lists of components.It included explorations of Language use on Twitter and in books, species abundance, baby name popularity, market capitalization, performance in sports, mortality causes, and job titles.
The primary purpose of the alloxonometer in general is to calculate and visualize the difference between two different realizations of large multinomial distributions in terms of how how types (e.g. words) in those distributions differ in frequency ranking, and to visualize how specific different types contribute to this difference.
The allotaxonometer was met with a welcome reception, having been cited 25 times in two years and eliciting positive comments from reviewers when used in papers e.g. “The unigram distribution analysis is thorough and instructive, some of the methodology (using rank-turbulence-divergence) was not familiar to me but seems like a good tool for the task.” Generally this type of visualization seems like it could be widely used in a number of disciplines and industries. Even within one use case, analysis of two corpora of textual data, the applications are many. Consider how often people use word clouds or tree-maps. A non-trivial percentage of those visualizations would be better analyzed with an allotaxonograph.
Problem Definition
The current iteration of the allotaxonometer has a number of barriers preventing its widespread use. Most importantly, the version which produces the sharpest visualization is implemented only in Matlab, and while the code for this use is open source, adapting that code for use on a users data of interest requires manually editing Matlab code, which can be daunting or perceived as impossible for many potential end-users.
Objectives
The potential widespread applicability of this tool for use with large quantities of textual data is of special interest to all members of this project, as we are all heavily considering exploring the industry side of computational social science in our careers in the next decade, and having an open-source widely-used tool on our resumes and featured on our personal websites would be a boon for our hireability in an industry position that might use such a in an industry position that might use such a tool. We see making the Allotaxonometer in a more common language and adding interactivity and functionality a way to increase its lifespan and advance research using it as a tool.
Project Objectives
Translate the Allotaxonometer from Matlab to Java Script D3 – The diamond plot which is the backbone of the allotaxonograph instrument. Getting this figure right means that we can trust our source-code. We can build the diamond plot for the first and most basic rank-turbulence metric.
Accept multiple data formats – Cover multiple cases for how the data might be formatted as if-else trees such that if the data is formatted in one of some number of likely formattings, the code will work without error. This would be in opposition to having only one required formatting and throwing (descriptive) errors when the user-entered data does not follow that formatting
Provide details README documentation – Including Environment Requirements, Basic Actions one can do, List of Troubleshooting Q&A, Description of the exact format the tool expects the data to come in, Definitions and troubleshooting for descriptive errors if the data comes in a different format than expected, History of the Project, Roadmap of Future Features and ways for the community to engage to help
Add Interactivity/animation – User Drag Timeline to Compare Dist at different time points and User enter Alpha value for interactivity, Drag and Drop Utility for data, If we achieve our stretch goal of including interactive tunable changing figures as we move the distributions across one axis of a multidimensional table (e.g. many different years of 1-gram distributions) then we would want a dataset that consists of some number of distributions exceeding 2 (as the pairs have) where each distribution corresponds to a year (or other consistent time period or other type of axis such as species distributions in elevation). If we do get there then an obvious example case is the baby names data, but where we have all of the distributions from 1968 to 2021.
Recreate Original Dataset – Use the same data as was used in the original 2020 Allotaxonometry paper. Explicitly, the pairs of distributions listed below along with links to their sources or explanations of how we will get them:
- Twitter 1-grams on the day after the 2016 US presidential election and the day after the Charlottesville Unite the Right rally
- Twitter 1-gram access is available for anyone who has access to the VACC. Sam has accessed this data before
- Tropical forest tree species abundance on Panama’s Barro Colorado Island (BCI) for 5 year censuses completed in 1985 and 2015 (https://datadryad.org/stash/dataset/doi:10.15146/5xcp-0d46
- US names of girls born in the US in 1968 and 2016 Names: https://catalog.data.gov/dataset?tags=baby-name, Total births: https://www.ssa.gov/oact/babynames/numberUSbirths.html
- US boy names for the years 1968 and 2016
- Publicly traded US companies in 2007 and 2018 by fourth quarter market capitalization
Resources
- Allotaxonometry and rank-turbulence divergence: A universal instrument for comparing complex systems P. S. Dodds, J. R. Minot, M. V. Arnold, T. Alshaabi, J. L. Adams, D. R. Dewhurst, T. J. Gray, M. R. Frank, A. J. Reagan, C. M. Danforth, November 18, 2020 https://pdodds.w3.uvm.edu/research/papers/dodds2020a/. https://compstorylab.org/allotaxonometry/papers/rank-turbulence-divergence/
- Gitlab Rep for current Allotaxonometer: https://gitlab.com/compstorylab/allotaxonometer
- https://mvarnold.w3.uvm.edu/storywrangler/lightbox/
- https://storylab.w3.uvm.edu/allotaxonometry/code/